 Kartoza
Kartoza Web Mapping Gallery
Here at maps.kartoza.com we provide a sample of the kind of online mapping products we are able to deliver using Open Source tools such as QGIS, UMN MapServer and GeoServer. All of the content of this maps gallery is available for download at https://github.com/kartoza/maps.kartoza.com
Boosmansbos
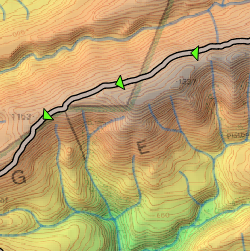
This is a hiking trail map for Boosmansbos Wilderness Area, near Heidelberg in the Western Cape Province of South Africa. The track shown is the recorded track from a Kartoza teambuilding hike we carried out in August, 2014.
The digital elevation model was created by extracting nodes from the national 1:50 000 countour lines and then using the QGIS interpolation tool to create a DEM - which was subsequently converted to a hillshade model.
Swellendam
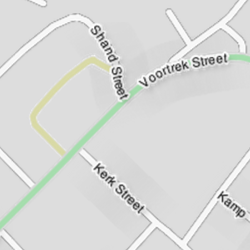
This map shows how you can use QGIS to publish your own custom maps based on OpenStreetMap data. The roads and building data was downloaded using our OSM Reporter tool which provides ready to use .qml styles along with the extracted data. Additional context data is provided using data from the South African Chief Directorate of National Geo-Spatial Information.
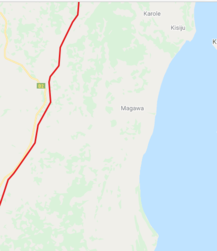
Cape Winelands District
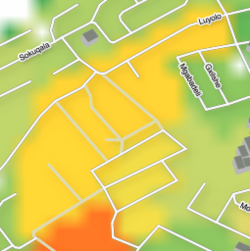
Based on data from OpenStreetMap and population data published by CIESIN with district boundary provided by The South African Demarcation Board, this is a simple local map of the Cape Winelands area.
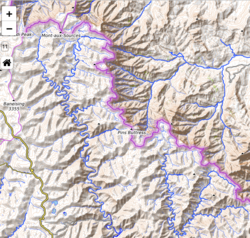
NGI 1:50 000 topographical map
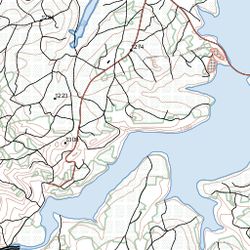
Based on data from (c) SA-NGI. This map shows data that has been styled in QGIS to resemble the 1:50 000 topographical map sheets that are produced by the South African Chief Directorate of National Geo-Spatial Information(NGI). NGI provides raster formats for the 1:50 000 topographic map series.
MapServer Demo
This map shows the capabilities of MapServer in serving dynamic data from a remote PostGIS database. A user edits the road layer in a Desktop GIS and the buffer dynamically gets updated in the viewer.
Cathkin Conservancy
This is a map of the Cathkin Conservancy near the Drakensberg Mountains, in KwaZulu-Natal. The project intends to understand the distribution of farms, natural features and man-made features. The map was created in QGIS with unique styles overlayed with a topo-style basemap.
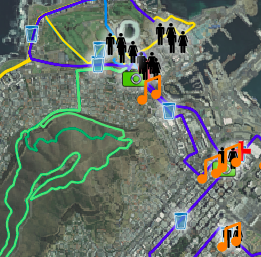
Flood Forecasting Planning
This map shows flood vulnerability indicators extracted from Open Street Map. The data shown on this map is extracted from OSM using Docker OSM. The leaflet webmap renderes GeoServer layers using CQL filters. Some the the data is rendered on the client from postgres.
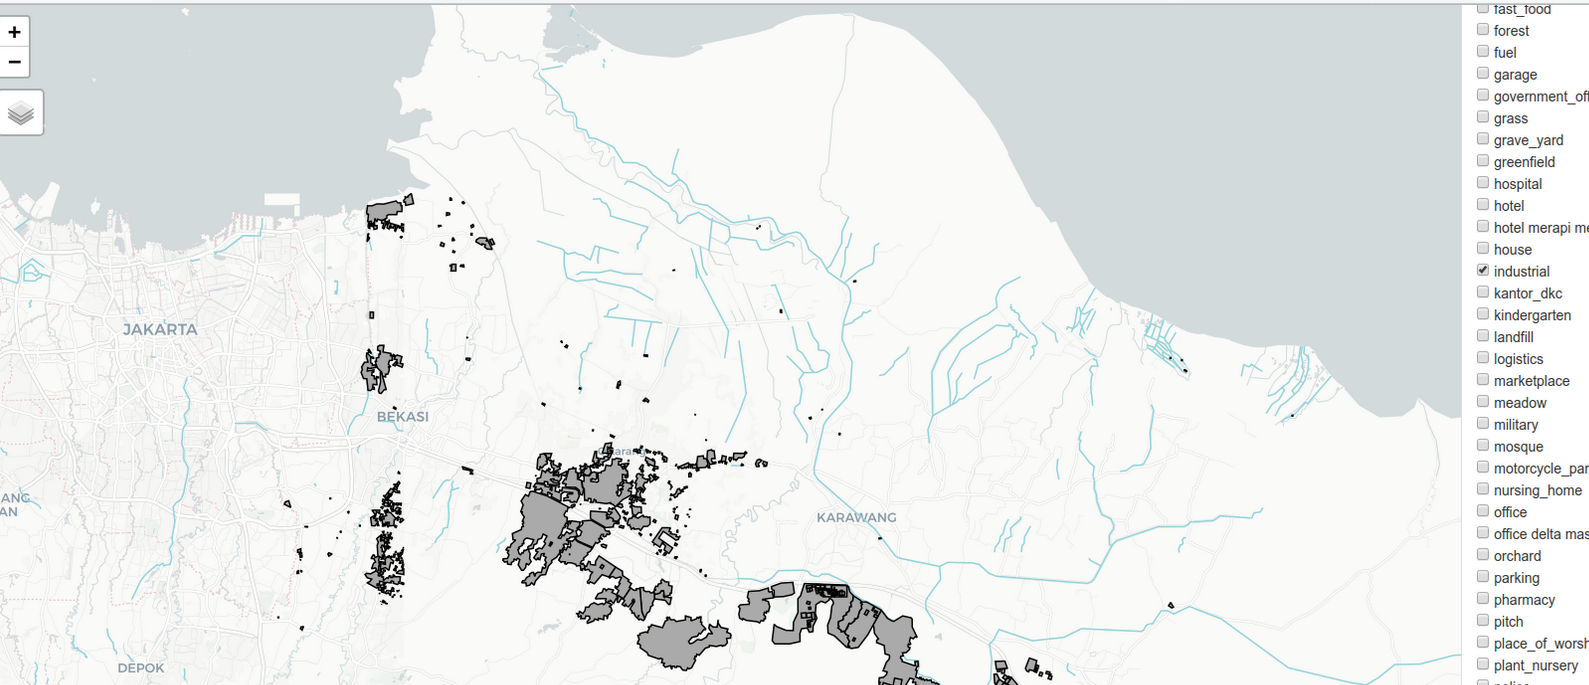
Vector tiles Rendering from PostgreSQL
This map renders vector tiles from a PostgreSQL database using Martin. The vector tiles are served using OpenLayers V6 and the styling is done on the client. To populate the database we are using Docker OSM. Docker OSM periodically fetches updates from the OSM API to maintain up to date data.

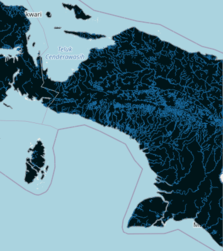
Kartoza FBIS Basemap
This map shows a basemap for South Africa with major emphasis on rivers and the map switches to the TopoStyle basemap when zoomed beyond 80K